Last updated on May 24, 2015
Last week the Midwest Economics Association (MEA) meetings were taking place in Minneapolis. Because a few friends were presenting at MEA, I decided to go check out the sessions at which they were presenting.
At one of the sessions I attended, a graduate student presented a very cool paper in which he had run a randomized controlled trial to determine the effect of a treatment variable D on an outcome Y, randomizing D and collecting information on a number of control variables X in addition to collecting information on Y.
The graduate student came from a good department, so he carefully motivated his paper by talking about the policy relevance of the relationship between D and Y, explaining that policy makers cared deeply about said relationship, and how they made a big deal of it.
When presenting his results, the presenter did what we commonly do in economics, which is to show a table presenting several specifications of the regression of interest, from the most parsimonious (i.e., a simple regression of Y on just D) to the least parsimonious (i.e., a complex regression of Y on D and all the available controls X).
The problem, however, was that the R-squared measure–the regression’s coefficient of determination–for the simple regression of Y on just D (i.e., the most parsimonious specification) was about 0.01, meaning that the treatment variable D explained about 1 percent of the outcome of interest.
I commented that this was interesting, given that if policy makers made a big deal about the relationship between D and Y, one of the points of the paper (which the author did not already make) should be that policy makers should really spend their time on other things. Indeed, if D explains only 1 percent of the variation in Y, focusing on D in order to stimulate Y is unlikely to be cost effective. In other words, there are other factors out there that explain 99 percent of the variation in Y, and it is likely that among those factors, at least one or two will play a significant role–or at least, a role that is much more important than D.
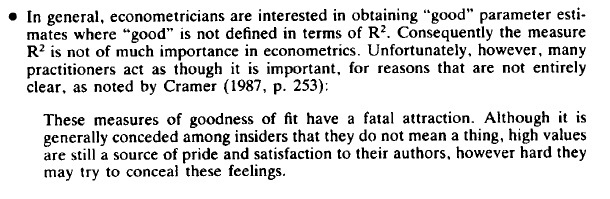
The foregoing strikes me as a useful use of R-squared, but the measure is misused more often than not, especially by neophytes and by people outside of economics. Indeed, in his Guide to Econometrics, which is still my favorite econometrics text, the late Peter Kennedy noted:
Indeed, I have frequently received referee reports where a reviewer noted that my regressions had a low R-squared because it was somewhere between 0.05 and 0.30. But in applied micro, what we typically care about is identification (which the grad student presenting at MEA had in droves) rather than how good our regression is at cranking out accurate predictions (which is essentially what R-squared tells you).
Besides, in applied micro, any R-squared around 0.25 is considered very good. Given how much unobserved heterogeneity we deal with, anything more than 0.30 is a crazy high R-squared when using cross-sectional data. Time series econometricians, however, often deal with R-squared measures of 0.85 or above, because their variables often tend to move together over time.
At any rate, unless you have a very good reason to do so such as the one I discuss above, you shouldn’t care either way about the size of your R-squared.