Last updated on February 21, 2016
Rob further writes:
I am not an econometrician–I spend my time playing with CGE models–but have to know something about econometrics. Recently I have been reviewing draft papers on a project using detailed tax data in my country–firm-level, matched with individual returns of employees, valued-added tax, import duties, etc.–for the period 2009-2014. A massive and rather unusual database. …
[M]ost of the papers do standard stats, comparing means between different sub groups, running a few regressions comparing some outcome across sectors etc. To me this seems not to do as much with the data as could be done. I kind of feel that one should be able to compare whole distributions, rather than some summary stats. But I am not sure what methods there are for that.
Another interesting–and important–question. There are methods to compare whole distributions. Let’s cover a few of those methods.
There are two possibilities here. Suppose you have a single variable Y broken into two groups. To take an example from my own work, suppose you have information on the duration of the hungry season experienced by rural households (Y), and you also know who grows some crops under contract (D = 1) and who does not (D = 0). You might be interested in two things:
- Is it the case that F(Y|D = 0) = F(Y|D = 1)? That is, is the distribution of the duration of the hungry season statistically similar between those who participate in agricultural value chains as growers and those who do not?
- Is it the case that F(Y) is statistically similar to a normal, logistic, Weibull, etc. distribution?
The former case is a two-sample test; the latter is a test with reference distribution.
As with everything else, a first option is to apply the intra-ocular trauma test, so named because it requires that something in a graph hits you right between the eyes. Using the data in Bellemare and Novak (2016), the two-sample test looks like this:
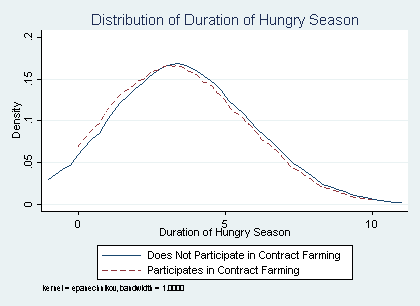
In this case, it is a bit difficult to tell whether the two distributions are “alike,” and there is no obvious intra-ocular trauma. To my eyes, they do look alike until you compare their means; and indeed, when running a t-test that their means are equal, I reject with over 99 percent confidence.
Again using the same data, the test with reference distribution–in this case, a normal distribution–looks like this:
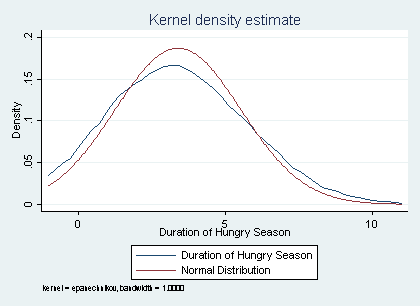
Though the duration of the hungry season kind of, sort of looks like a normal on its own, the actual normal distribution overlaid on the kernel density estimate above clearly shows that the two distributions are different. In this case, the intra-ocular trauma is especially pronounced.
What if you would rather not rely on a subjective criterion like the intra-ocular trauma? It turns out there is a test for that, the Kolmogorov-Smirnov (K-S). The K-S test is a nonparametric test that allows conducting both of the tests delineated above, and which can easily be conducted in Stata with the ksmirnov command. Using my data, a test that the duration of the hungry season is the same across the two samples of those who participate in contract farming and those who do not yields the following:
. ksmirnov hungry, by(cf)

Two-sample Kolmogorov-Smirnov test for equality of distribution functions

 Smaller group D P-value Corrected
 ----------------------------------------------
 0: 0.0001 1.000
 1: -0.0887 0.010
 Combined K-S: 0.0887 0.019 0.016
The formatting makes it a bit hard to understand what is going on, but what we are interested in is in the last line, viz. the p-value of the K-S test. Remember that the null hypothesis posits that the distribution of the duration of the hungry season is the same between treatment and control groups. Here, the p-value indicates that we reject this with over 95 percent confidence. (The corrected p-value in the last line is included because the regular p-value tends to be too large in small samples, i.e., samples with N < 50.)
Again using my data, a test that the (normalized) duration of the hungry season is equal to a standard normal distribution yields the following:
. summarize hungry

 Variable | Obs Mean Std. Dev. Min Max
-------------+--------------------------------------------------------
 hungry | 1182 3.3989 2.133096 0 10

. ksmirnov soudure=normal((hungry-3.3989)/2.133096)

One-sample Kolmogorov-Smirnov test against theoretical distribution
 normal((hungry-3.3989)/2.133096)

 Smaller group D P-value Corrected
 ----------------------------------------------
 soudure: 0.1029 0.000
 Cumulative: -0.0595 0.000
 Combined K-S: 0.1029 0.000 0.000

Note: Ties exist in dataset;
 there are 21 unique values out of 1182 observations.
Note that I am comparing the distribution of the hungry season with a normal distribution (normal) whose mean is identical to the sample mean of the duration of the hungry season (3.3989) and whose standard deviation is also identical to the sample mean of the duration of the hungry season (2.133096). That is why I summarize the variable first: So I can feed the right values into the test in order to test that my variable looks like it follows a normal with a mean equal to its empirical mean and a standard deviation equal to its standard deviation. In this case, both the regular and the corrected p-values lead us to reject the null that the duration of the hungry season is distributed normally beyond any reasonable doubt.
(To be fair, if you were really interested in testing for normality, a better test would the Jarque-Bera test for normality, which is more powerful than the K-S test. As such, my opinion is that the better, more common use of the K-S test is for a two-sample test.)
There are other tests one can use to compare distributions. A more recent test–one I am not familiar with beyond knowing of its existence–is this test by Bera (of Jarque-Bera fame) et al. (2013).
[…] ‘Metrics Monday: Are Those Two Distributions Alike? – Marc Bellemare […]