Skip to content

Marc F. Bellemare Posts

Top 5 Agricultural Economics Journals, As Per the New Impact Factors–2015 Edition

From the ISI Web of Knowledge Journal Citations Report, here is the new top 5 of agricultural economics journals:

  1. Food Policy 1.799
  2. Food Security 1.495
  3. American Journal of Agricultural Economics 1.327
  4. Journal of Agricultural Economics 1.278
  5. European Review of Agricultural Economics 1.271

The number to the right of each journal name is the journal’s impact factor, which has been calculated on the basis of calendar year 2014 citation numbers.

This has not been a good year for agricultural economics journals–both Food Policy, which I edit, and the American Journal of Agricultural Economics, at which I serve as associate editor, have seen their impact factor go down. But that seems to be true of a lot of journals. The Journal of Development Economics, for example, has a new impact factor of 1.798. If I recall correctly, it used to be well above 2. Moreover, a few journals that I believe to be very good surprisingly did not make the top 5.

But that is only one top 5. Bear in mind that the rank ordering might differ significantly depending on what other indicators of quality you look at, or whether you consider reputation. In agricultural and applied economics departments, for example, many people still consider the AJAE as the no-contest top journal in the field, no matter what impact factors say.
Messing with Markets: Agricultural Supply Management Policies Disproportionately Hurt the Poor

I talked about this a few months ago when I discussed the article by Ryan Cardwell et al. in Canadian Public Policy, but here is more, from a short article by the Montreal Economic Institute:

The main purpose of Canada’s supply management policies, implemented for dairy, poultry and eggs in the 1970s, was to protect farmers from price fluctuations. These policies have three main components: 1) fixing prices, 2) establishing tariff barriers in order to keep lower-priced foreign goods out, and 3) managing supply with quotas so as to avoid price-depressing overproduction.

The beneficiaries of these policies, at least at first glance, are Canada’s 13,500 dairy, poultry, and egg farms, representing about 1/8 of all farms in the country. However, supply management hurts all 35 million Canadian consumers by forcing them to pay consistently more for milk, chicken, and eggs, as well as for other products that use these foodstuffs as ingredients.

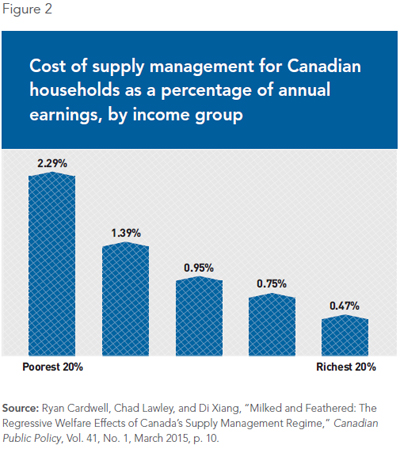
Importantly, supply management disproportionately hurts poor Canadians. According to a recent study by researchers from the University of Manitoba, supply management imposes an additional cost of $554 a year on the richest 20% of households, representing 0.47% of their incomes. In contrast, the corresponding burden for the poorest households ($339 a year) represents 2.29% of their incomes. These policies are therefore heavily regressive, hurting poor households almost five times as much as rich households.

‘Metrics Monday: What to Do With Missing Data

Last week I talked about what to do what to do with an obviously endogenous control variable. This week, I answer a question received via email:

… [Y]ou should consider publishing a blog post about how you handle various types of missing data when you are working with secondary data. … I come across data with a lot of [missing] values when analyzing managing household data. I get confusing and contradicting responses when I search on Google as well as when I ask my peers about how to treat missing values. I feel how we handle missing values affects the reproducibility of one’s results hence I wanted to learn if you have any suggestions on how to manage missing values. I am of the view that I may not be the only one who can benefit from learning how you handle this issue when analyzing data for your various research projects.

That is a good question, and its object is something which is not discussed often in econometrics classes, where students are often presented with data sets that have been cleaned and have no missing values. As the email indicates, real-world data is often much messier.